Documentation Index
Fetch the complete documentation index at: https://docs.messagedesk.com/llms.txt
Use this file to discover all available pages before exploring further.
Workspace Analytics
The Analytics dashboard gives you a snapshot of messaging activity across your workspace: messages sent, delivery rates, inbound volume, and breakdowns by channel and user.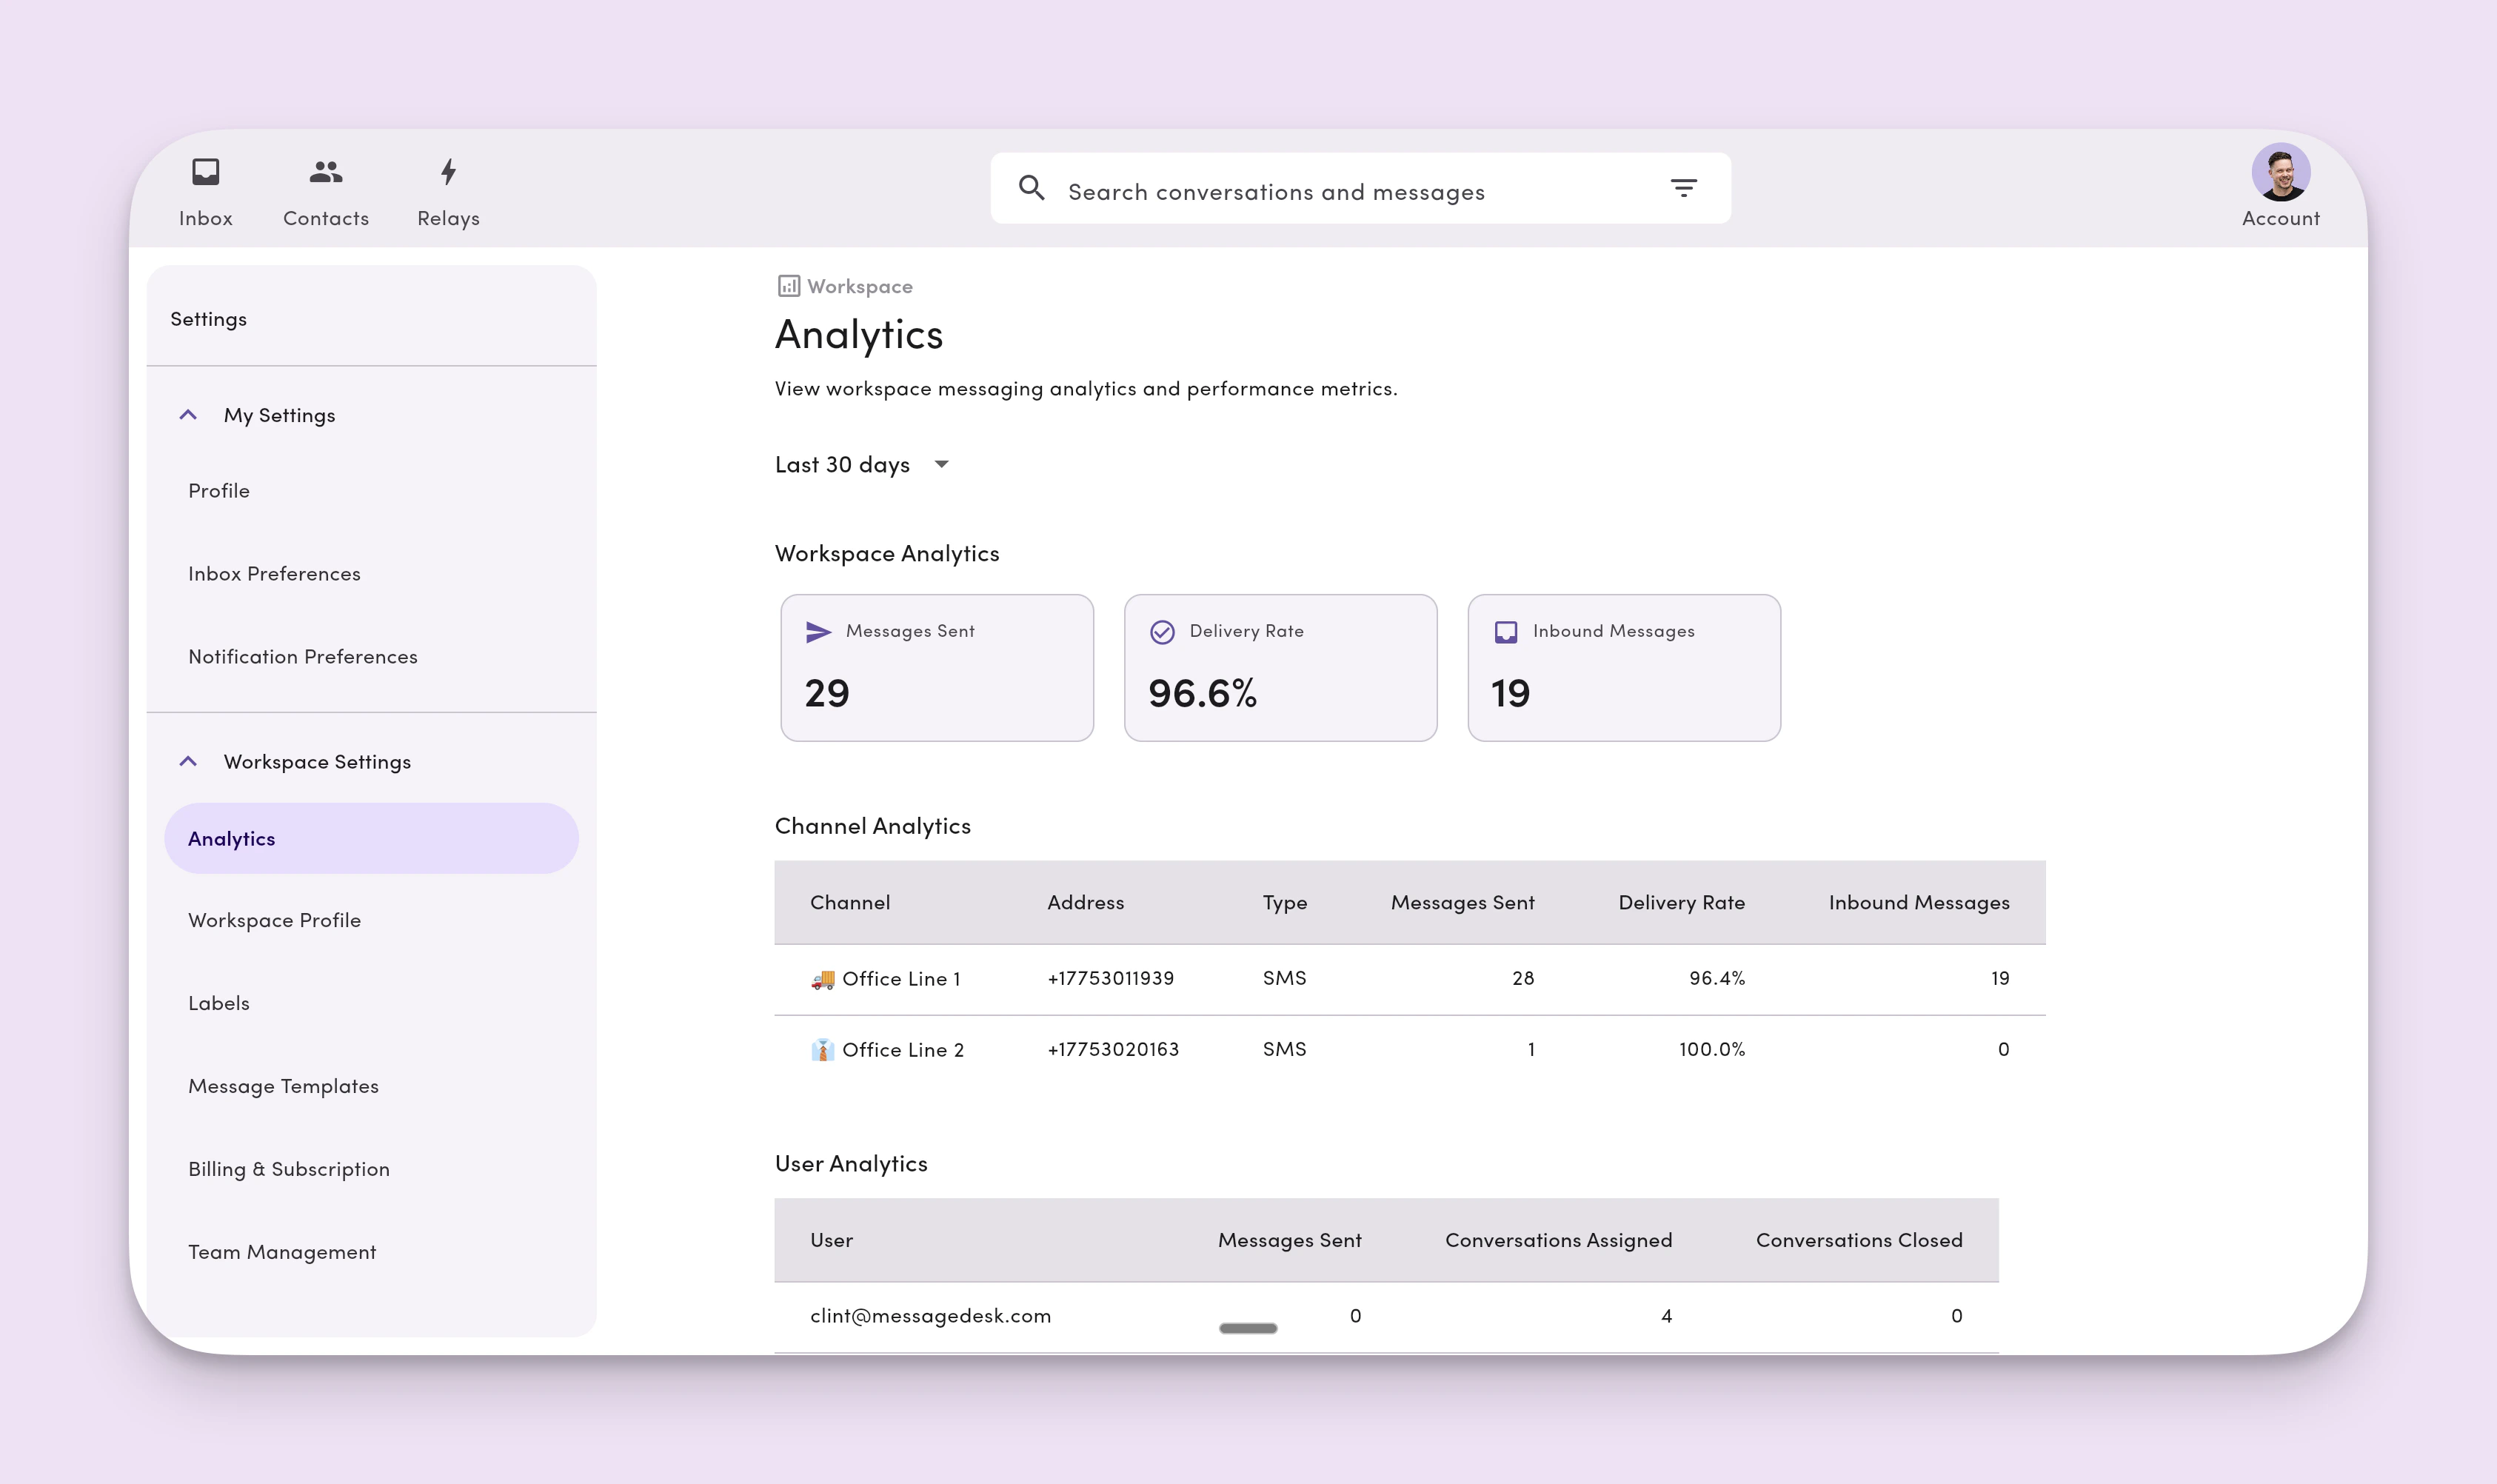
Open the analytics dashboard
- Click your profile icon (top-right).
- Select Settings.
- In the left nav, open Workspace Settings → Analytics.
/settings/workspace-settings/analytics.
Permissions. Access to the analytics dashboard is controlled by your role. See Roles & Permissions for details.
Top-level metrics
The dashboard shows three primary metrics at the top:- Messages sent. Total outbound messages from your workspace.
- Delivery rate. Percentage of sent messages successfully delivered.
- Inbound messages. Total messages received across every channel.
Channel-level analytics
Below the top-level metrics, you’ll see activity by channel (phone line). Use this to compare volume and performance across lines in your workspace.User-level analytics
The dashboard also shows activity by user, so you can see how messaging volume splits across your team.Time windows
Use the time-window selector to filter every metric by a specific date range:- 30 days
- 60 days
- 90 days
- 180 days
- 365 days
Data refresh. Analytics data doesn’t update in real time. The dashboard loads a snapshot when you open it. Refresh the page to see the latest data.
FAQ
Who can access the analytics dashboard?Access depends on your role and the Analytics permission assigned to it. Admins have full access by default. See Roles & Permissions. Why doesn’t the data update automatically?
Analytics queries aggregate large volumes of messaging data. To keep performance fast, the dashboard loads data on page load rather than streaming live updates. Can I export analytics data?
Export isn’t currently available from the analytics dashboard. Contact support if you need a data export.